Graph-map & topic-map (experiment)
Side experiment, not part of the core tool. Everything here only reads a
.rete(and the community pyramid already inside it) and emits a standalone PMTiles archive + a static viewer. The format and CLI are untouched. Code:experiments/graph-map/.
A .rete file already carries a Louvain community pyramid — a multi-level
clustering of the graph. This experiment turns that into a slippy map: pan
and zoom a graph like a web map, where each zoom band is a coarser/finer level
of the hierarchy. Two complementary lenses ship:
| structural graph-map | semantic topic-map | |
|---|---|---|
| groups by | link topology (community pyramid) | text similarity (community literals) |
| colour | level / connectivity | LDA topic |
| label | size / connectivity | top words |
| answers | "how is it wired?" | "what is it about?" |
Both deliver as a single HTTP range-readable .pmtiles rendered by MapLibre
GL in the browser — the same publish-and-query-by-byte-range story as .rete
itself: no server, no full download.
Open the live viewers (tiles range-read from the HF Space): structural map · topic map (pyramidal LDA) · 3D side-elevation — deck.gl · 3D — three.js + fog
A different browser lens on the same graphs — ask the graph, a transformers.js graphRAG search — has its own page now.
Why a map at all
Force-directed pictures of a big graph collapse into a hairball. A map fixes that with levels of detail: zoomed out you see a handful of coarse regions (the "continents"); as you zoom in, finer structure resolves — exactly how a web map goes country → city → street. rete's pyramid is that level hierarchy, so the mapping is direct. (Prior art: GMap, "Visualizing Graphs and Clusters as Maps".)
1. Structural graph-map — the community pyramid
Nodes are rete's pyramid communities; the most-connected hubs dominate when zoomed out. Each super-community is drawn as a translucent convex-hull boundary, with its finer child communities rendering inside it as you zoom.
Pipeline (build_map.py):
rete summary <file>            → weighted community graph (pyramid round 0)
igraph multilevel Louvain      → coarser super-communities (extra zoom levels)
igraph DRL layout              → 2D coords for the base communities
size-weighted centroids upward → coords for every coarser level
convex hulls + GeoJSON         → tippecanoe → graphmap.pmtiles
On the 12M-triple Wikidata slice that becomes 4 zoom bands — 38 → 103 → 2,198
super-communities over 60,000 base communities (a 12 MB .pmtiles).
 Zoomed out: coarse super-communities as translucent hulls, sized by connectivity.
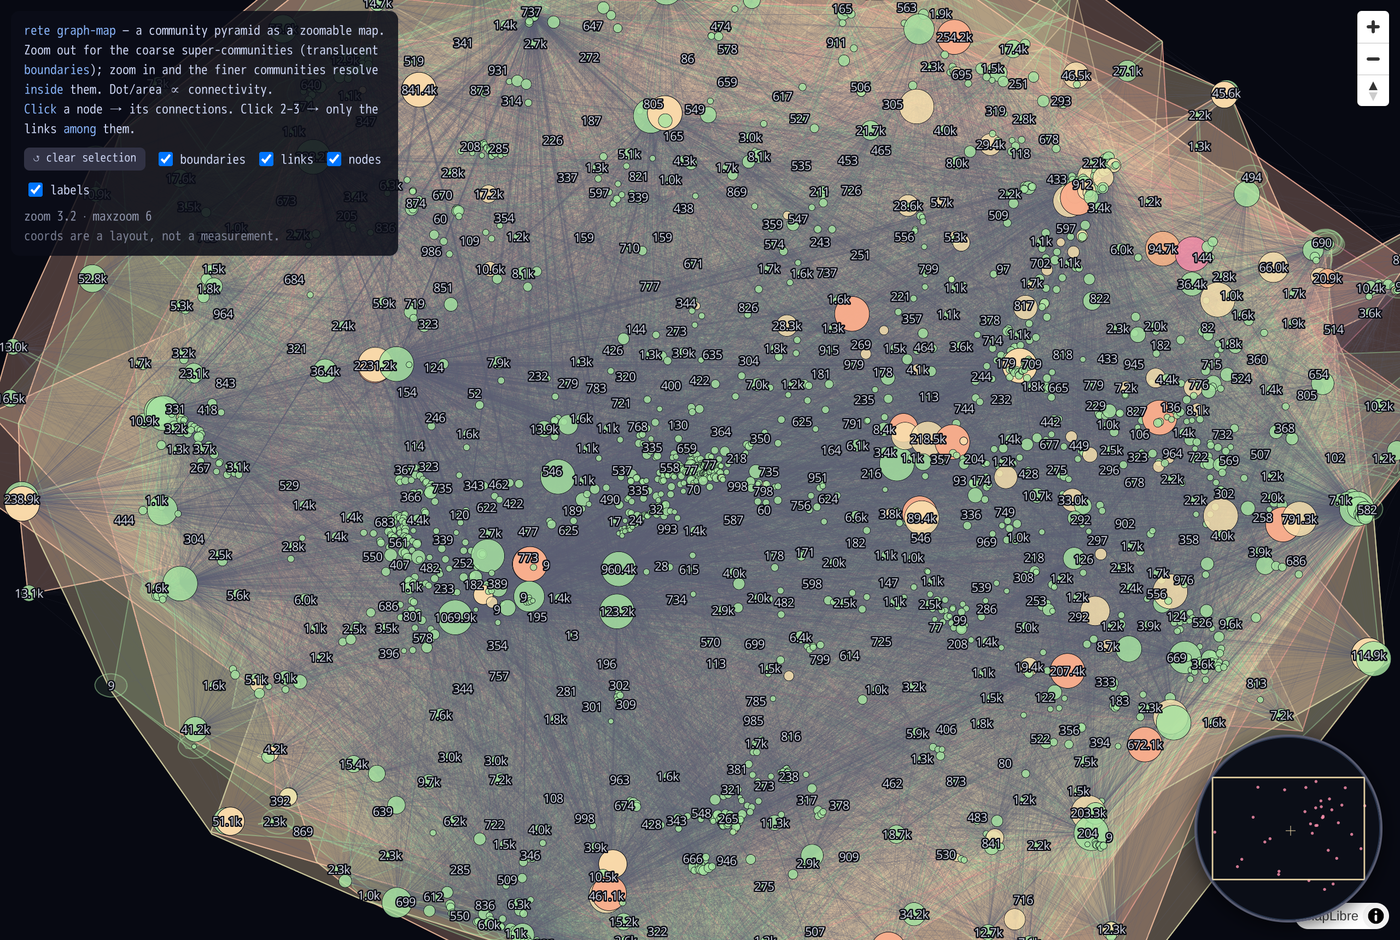 Zoomed in: finer pyramid communities resolve inside their parent boundary.
In the viewer (viewer.html):
zoom-out shows the whole graph as a small island; hover a node for level /
size / sub-community count; click a node to highlight all its links, then a
2nd/3rd to show only the links among the selected set. A round minimap
(bottom-right) shows the whole graph with a viewport box; a clear button and
layer toggles (boundaries / links / nodes / labels) control what's drawn.
2. Semantic topic-map — communities by LDA topic
The structural map says how the graph is wired; this says what each cluster is about. rete supplies the two hard parts — the Louvain partition and the per-community text — and LDA is the standard downstream step (see Topic modeling). Communities are laid out by text similarity, coloured by their dominant LDA topic, and labelled by top words; a legend maps each colour to its topic keywords.
Pipeline (build_topic_map.py):
rete communities --json --profile        → communities w/ members, text, profile
CountVectorizer + LatentDirichletAllocation (scikit-learn) → topic per community
TruncatedSVD(2) over TF-IDF               → 2D text-similarity layout
per-topic convex hulls + GeoJSON          → tippecanoe → topicmap.pmtiles
- z0 — one translucent hull per LDA topic (the legend colours), labelled with that topic's keywords.
- z1+ — the communities inside, coloured by topic, labelled by top words.
Hovering a community shows what it is — its dominant
rdf:typeand its characteristic properties (top predicates), both straight fromrete communities --profile. A legend lists every topic's keywords; clicking a topic (or its region) isolates it, and layer toggles + a show-all button control the view.
Run on the 1 GB Wikidata bundle (120 M triples → 140 communities of ≥5 members, 10 LDA topics), real themes separate cleanly — e.g. rivers (river, abhainn, ruda), villages (india, gujarat, village, dorf), settlements (pierre, saint, selo, oleksandrivka), people (michael, richard, robert, actor), British footballers (brit, futbolista, britanski), and Wikimedia disambiguation pages.
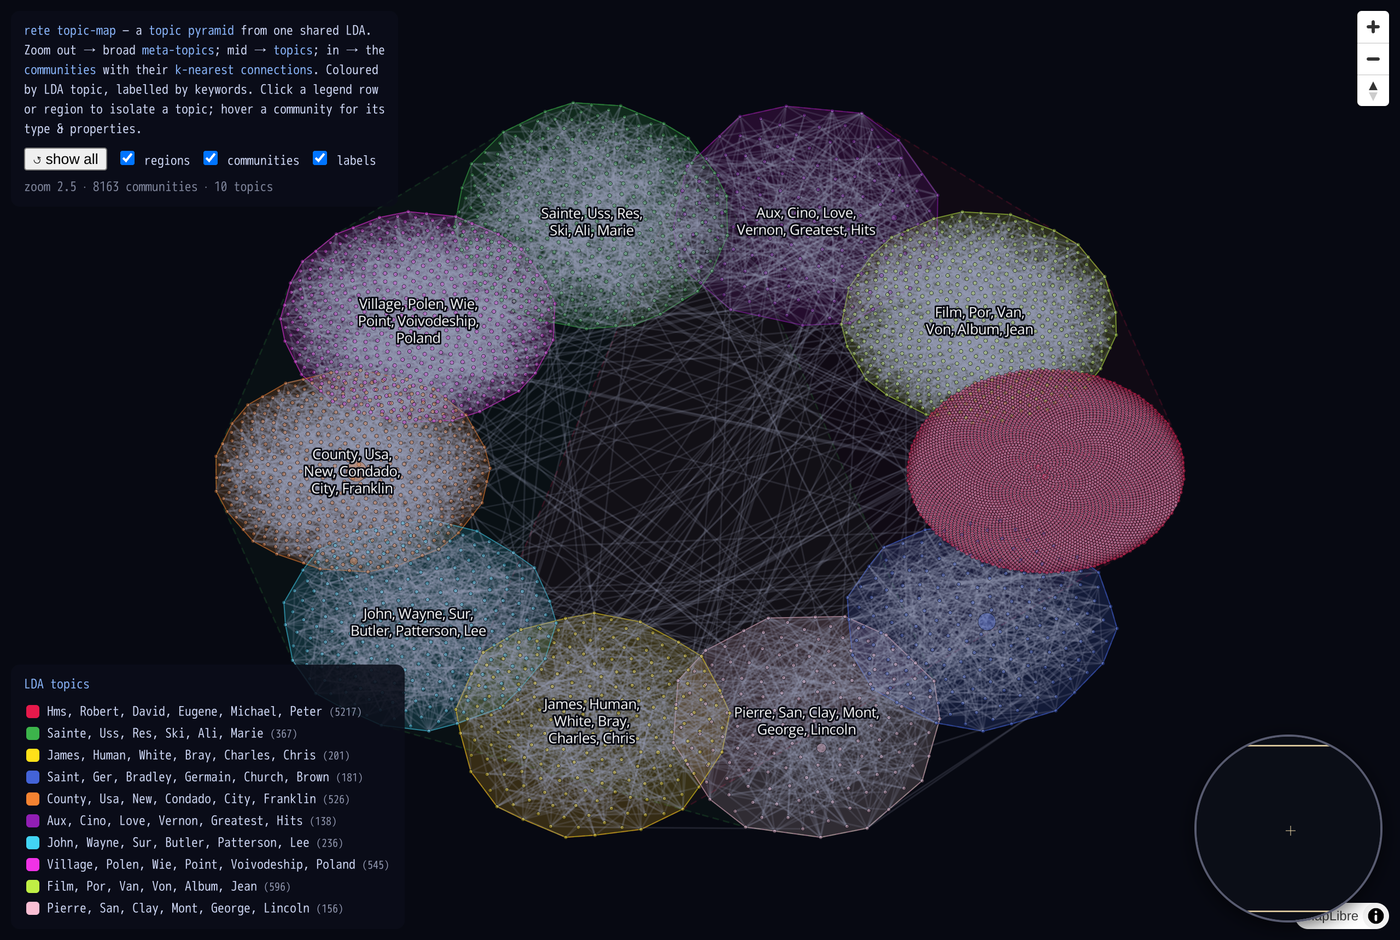 Topic regions coloured by LDA topic; the legend lists each topic's keywords.
Click a region or legend row to isolate one topic.
Topic regions coloured by LDA topic; the legend lists each topic's keywords.
Click a region or legend row to isolate one topic.
Data note. Topic modelling wants a densely linked graph with rich text. The Wikidata truthy slice is link-sparse, so most communities are small; the 1 GB tier still surfaces a handful of large, coherent ones. A citation network (dense links + abstracts) is the canonical fit — see Topic modeling.
3. 3D side-elevation — the pyramid as stacked strata
A button to rotate the map 90° and see it from the side: each zoom level
becomes a horizontal plane stacked in 3D, and the lines between planes are
the parent→child links of the community hierarchy. Built with
deck.gl's orthographic OrbitView (MapLibre is 2D-only), so
it's a true projection you can orbit by dragging.
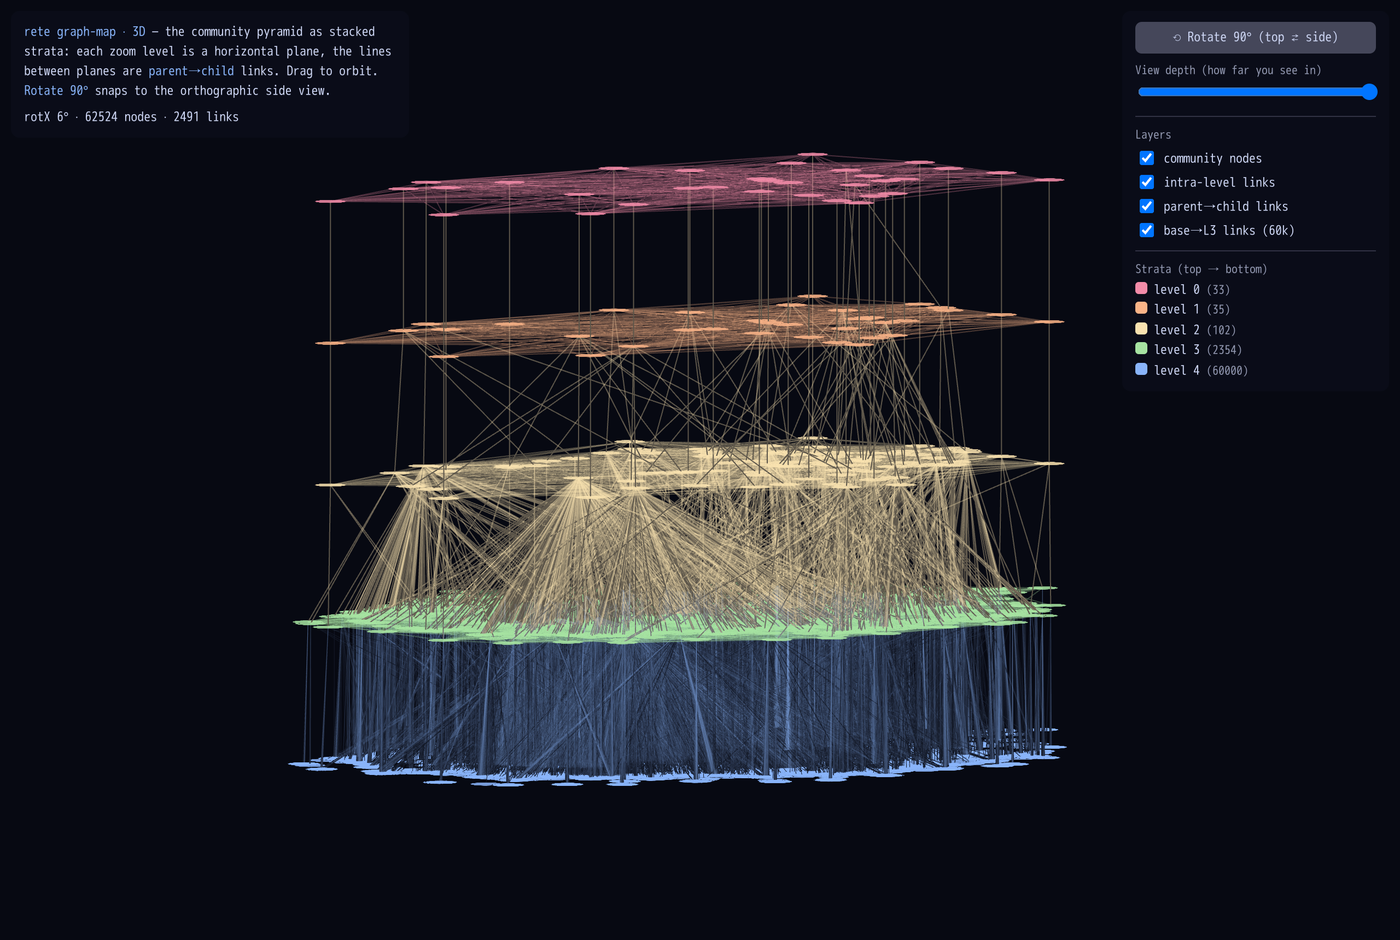 Level 0 (coarse super-communities) on top down to the 60k base communities as
the bottom plane; tan lines are parent→child links between strata.
Level 0 (coarse super-communities) on top down to the 60k base communities as
the bottom plane; tan lines are parent→child links between strata.
In the viewer (viewer-3d.html):
- Rotate 90° snaps between the top-down view and the orthographic side view.
- A view-depth slider controls how far into the stack you can see (a clipping plane sweeping along the depth axis) — peer at the front strata or reveal the whole volume.
- Layer toggles for nodes / level-floor hulls / size labels / intra-level links / parent→child links / base→L3 links (the 60k base communities tethered to their level-3 parents), and a per-level legend.
There are two implementations of the 3D view:
viewer-3d.html— deck.gl orthographicOrbitView: data-layer abstractions + built-in picking/tooltips; the depth slider is an alpha cutoff along the depth axis.viewer-3d-three.html— a three.js prototype: glowing points, and the depth slider is real camera fog (FogExp2) so "how far you can see" is physically correct — pull it in to fade out the far strata, push it out to see the whole volume.
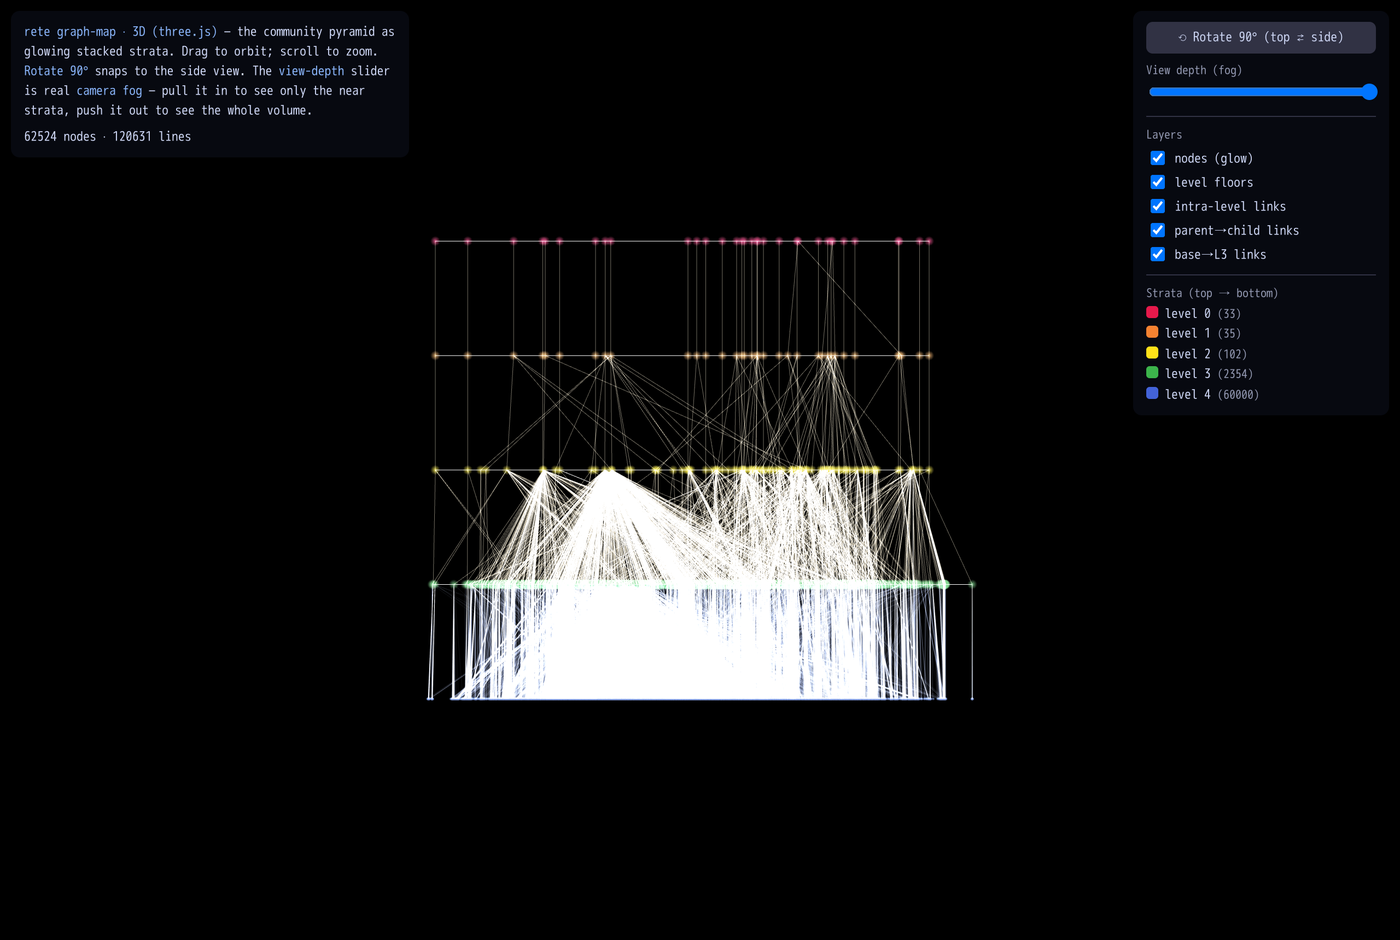 The three.js prototype: glowing stacked strata with camera-fog depth.
Run it
Both maps share a standalone toolchain image (tippecanoe + python-igraph +
scikit-learn + pmtiles) and call the rete binary already built at
target/release/rete.
docker build -t rete-graphmap -f experiments/graph-map/Dockerfile experiments/graph-map

# structural map
docker run --rm -v "${PWD}:/work" -w /work rete-graphmap \
  data/wikidata-100MB/wikidata.rete -o experiments/graph-map/out

# topic map (LDA)
docker run --rm -v "${PWD}:/work" -w /work --entrypoint python rete-graphmap \
  experiments/graph-map/build_topic_map.py data/wikidata-100MB/wikidata.rete \
  --topics 12 -o experiments/graph-map/out
View with the Range-capable static server (PMTiles needs 206 responses):
python experiments/graph-map/serve.py 8000
#  http://localhost:8000/viewer.html          (structural map + minimap)
#  http://localhost:8000/viewer-topics.html   (LDA topics + legend)
#  http://localhost:8000/viewer-3d.html        (3D stacked-strata side view, deck.gl)
#  http://localhost:8000/viewer-3d-three.html   (3D prototype, three.js + camera fog)
The 3D viewer reads graphmap-3d.json (node positions per level + intra-level
edges + parent→child links), which build_map.py emits alongside the
.pmtiles.
See experiments/graph-map/README.md
for all flags (--max-base, --footprint, --topics, --maxzoom, …).
Caveats (it's an experiment)
- Layout is the cost, not the tiling. DRL handles ~100k base communities;
past that,
--max-basekeeps the most-connected ones. - Coordinates are a layout, not a measurement — proximity ≈ relatedness, axes mean nothing.
rete communitiesrecomputes Louvain, so the topic map's partition is not byte-identical to the stored pyramidsummaryuses; the two maps are complementary views, not the same nodes.