rete
A single-file, range-queryable RDF graph format — put it on a URL, run SPARQL, no server.
github.com/caviri/rete · crates v0.3.0 · stable file-format generation 1 (0x05)
rete packs an RDF graph (or a full dataset of named graphs) into one immutable
.rete file with its own dictionary, permutation indexes, and a pyramidal
community summary. Drop the file on S3, GitHub, or any HTTP host that honors
Range requests, hand a client the URL, and query it in place — fetching only
the bytes a query needs. The same engine compiles to WebAssembly, so the browser
queries the file directly with no backend.
Think Parquet / SQLite-over-HTTP / PMTiles, but for RDF + SPARQL.

Lazy opening: the file stays where it is — on a bucket or on disk — and a query fetches only the bytes it touches. Aggregation streams, so even a COUNT over 9.83 billion triples fits in 2 GiB.
Why
- No database server. The file is the database. Publish once to static hosting; clients query by URL.
- Bounded, progressive reads. A query touches a handful of byte ranges, never
a linear scan. The coarse "overview" graph can be fetched first (3 ranges —
23.3 % of
davidrumsey.rete, and the share tracks how big the dictionary is) before drilling into detail — PMTiles-style zoom, for graphs. - Real SPARQL. SELECT / ASK / CONSTRUCT / DESCRIBE over BGPs, joins, OPTIONAL, UNION, MINUS, FILTER, VALUES, property paths, GROUP BY / aggregates, and named graphs — evaluated against the file.
- In the browser.
rete-wasmruns the identical engine client-side; the demo page loads the overview over HTTP ranges and runs SPARQL with no server. - Safe on untrusted input. A truncated or corrupt file from an arbitrary URL yields an error, never a panic (fuzz-tested).
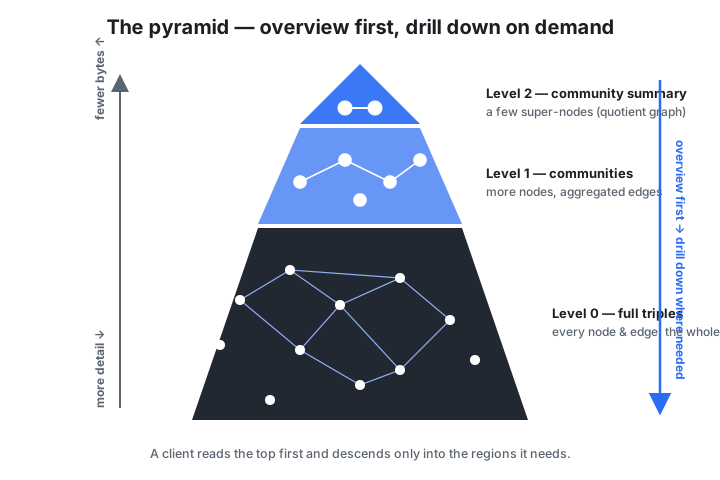
The pyramid: read a coarse summary first, then drill into detail only where a query needs it.
60-second tour
# Build a file from N-Triples (or .nq / .ttl; merge several; or read stdin):
rete build examples/social.nt -o social.rete

# Query a triple pattern, a BGP, or full SPARQL:
rete query  social.rete --predicate '<http://ex/knows>'
rete why    social.rete --predicate '<http://ex/knows>'   # result provenance
rete sparql social.rete "PREFIX e: <http://ex/> SELECT ?p ?age WHERE { ?p e:age ?age . FILTER(?age > 27) }"

# Query straight from a URL — fetches only the byte ranges needed (http or https):
rete query-url https://my-bucket.s3.amazonaws.com/social.rete --object '<http://ex/Alice>'

# Look at the coarse graphs without reading the index:
rete summary social.rete    # structural (Louvain communities)
rete schema  social.rete    # semantic (by rdf:type)
Clients
The same engine, in your language of choice — every client opens local files and remote URLs (lazy HTTP range reads) and returns parsed SPARQL results:
| Client | Get it | Runs on | Docs |
|---|---|---|---|
Python — rete-graph on PyPI | pip install rete-graph | CPython ≥ 3.9 everywhere, plus Pyodide (JupyterLite, marimo WASM) | Python API · build tutorial |
JavaScript — rete-graph on npm | npm install rete-graph, or one <script> tag via CDN | Node ≥ 18, browsers (bundlers or script-tag) | JavaScript API |
R — rete (from this repo; CRAN/R-universe pending) | remotes::install_github("caviri/rete", subdir = "clients/r", build = FALSE) | R ≥ 4.2 + Rust toolchain; results as data frames | R API |
Rust — rete-core / rete-cli (in this repo; crates.io release pending) | cargo add rete-core --git https://github.com/caviri/rete | anywhere Rust runs — native + wasm | Rust API · CLI |
| Blender — add-on (engine bundled) | Install the rete-*.zip from clients/blender | Blender ≥ 4.2; SPARQL results become 3D scenes | Blender add-on |
| Browser, zero install | — | any modern browser | Playground · SPARQL IDE |
| Agents — MCP server + Claude Code plugin | /plugin marketplace add caviri/rete — or point any MCP client at the gateway | ChatGPT, Claude, pydantic-ai, any MCP host | Agentic interfaces |
| Agent frameworks — the graph as tools, in process | pip install rete-graph + your framework | LangChain / LangGraph, Pydantic AI; local or remote graphs, no server | LangChain & Pydantic AI |
Documentation
Start here
- Graph data 101 — new to graphs/RDF? A beginner's tour, framed by the questions you can ask.
- Getting started — install (Docker-only), build, query, deploy.
- Real-world scenario — publish a queryable SBOM to a URL; curl examples.
Explore in the browser
- Playground — the flagship demo: 65 real datasets queried live over HTTP ranges, with SPARQL + SQL + semantic search, media viewers, and AI helpers. Launch it →
- Plaza — dataset gallery — browse published datasets as live cards. Open it →
- SPARQL IDE — yasgui·wasm — a Yasgui-style IDE where the endpoint is a
.retefile: paste a URL (read lazily over HTTP range) or drop a local file; tabs, autocomplete from the dataset's own labels, pivot/turtle views, share links. Launch it → - Historical atlas — SPARQL + GIS: border polygons, timeline, five projections.
- 2D match replay — a football match replayed on a canvas pitch from a spatiotemporal
.rete(player + ball positions, 5 fps; pick any match). Launch it → - Subtitle timeline — one film subtitled in 20 languages; scrub the timeline and watch a line of dialogue appear in every language at once. Launch it →
- World Cup 2022 final — Argentina 3–3 France replayed from real StatsBomb positional freeze-frames: every player's place at every moment, with a live scoreboard and goal jumps. Launch it →
- Ask the graph — graphRAG search over a
.rete, entirely in the browser. - WebGPU coherence (experimental) — several sources making causal claims, none of them certain: where do they contradict each other, which fallacies does the graph itself expose, and can a GPU find them faster than one CPU core? Circular reasoning, causes-vs-prevents, slippery slopes and confounders are all found by arithmetic — no language model reading anything — in an editable sandbox that draws your argument, traces belief spreading step by step, and exports it as RDF-star you can
rete build. Write your own disagreement down, share it as a link, and see where it actually breaks; pairs with the fallacy-annotation experiment. Then a live benchmark: same-line checks cap at ~2×, chain checks reach 15–17×. Try it → - Graph-map, topic-map & 3D (experimental) — the community pyramid as a slippy map.
In 3D — a SPARQL answer becomes geometry
- Human anatomy — pick any bone, muscle, organ or nerve in the
z-anatomygraph and see its real 3D neighbours: what touches it, shares its tissue or is thermally coupled to it, plus the diseases located there. Launch it → - A building, queried — the FZK-Haus IFC model as a graph: pick a wall, door, window, slab or room and see its floor, the rooms it encloses and everything within reach in 3D, with real SPARQL + geo3 (GeoSPARQL in three dimensions). Launch it →
- Architecture vs structure (BIM pair) — the same house modelled twice by one TUM BIM Project team: the architectural envelope (walls, curtain walls, doors, windows, furniture) and the structural skeleton. Diff them, or overlay the skeleton inside the translucent envelope. Launch it →
- Neurons & astrocytes — a WebGL viewer that streams electron-microscopy meshes out of the file and rebuilds each cell in your browser: rotate an astrocyte, or show the whole neuron cluster coloured by neurotransmitter. Launch it →
Drawing & scripting
- Mark Lombardi's networks — 51 of Lombardi's hand-drawn conspiracy diagrams (banks, shell companies, arms deals) read live out of one
.reteover HTTP range and redrawn in the browser. Launch it → - JS lab — an Observable-style notebook: a JavaScript editor beside a live visualization, the code querying a remote
.reteas you type. Launch it → - JupyterLite notebook — a full Jupyter notebook running the
rete-graphPython client in your tab, on a Pyodide kernel:pip install-free, queries a remote.reteover HTTP range. Launch it →
Guides
- CLI reference — every
retesubcommand. - SPARQL support — exactly what the engine evaluates, including
SERVICEfederation. - GeoSPARQL — geometry filters + time: "which territory contained this point in year Y?"
- SHACL validation — validate
.retegraphs against SHACL Core shapes, locally or over a URL. - Reasoning & coherence — prototype OWL RL / RDFS reasoner; find incoherent points.
- Federated queries — query several
.retefiles (local paths and/or URLs) as one. - Semantic zoom — the schema pyramid: overview first, drill into detail.
- Compatibility & Cypher — RDF interop, validation paths, and the Cypher subset.
Publish & share
- Dataset Cards — self-describing metadata embedded in the file.
- Hosting your .rete — put the file on R2, Zenodo, GitHub Pages, or S3 and query it by URL.
- Media & SQL companions — images, IIIF, 3D and audio in query results; Parquet/SQLite companions.
Graph analysis
- Topic modeling (LDA) — label each community's theme:
rete communities+ scikit-learn LDA. - Multi-criteria communities — partition the same graph by different relations/attributes; combine criteria.
Development
- Architecture — workspace map, build/read/query pipelines, range model, and extension points.
- Format specification — the on-disk byte layout, for implementers.
- Rust API — the stable
rete-corefacade modules and embedding examples. - WASM & JavaScript API — the browser bindings: query, remote reads, caching.
- Parallel in the browser (experimental) — Web Worker reachability + shared-memory threads.
- Tables, VKG & big builds — entity/property tables, virtual knowledge graphs, large ingestions.
- Benchmarks — sizing, the OpenCitations/Oxigraph comparison, and the LUBM-style suite.
- SPARQL 1.1 conformance — the W3C test-suite scorecard.
Version & status
Developed in the open at github.com/caviri/rete.
The crates are v0.3.0, the first release on crates.io. Stable file-format
generation 1 (header byte 0x05) was frozen on 2026-07-14 and first released in
0.3.0; the experimental generations 0x01–0x04 predate it and must be rebuilt
from RDF source. No backwards-compatibility promise is made before 1.0.0 —
neither for the .rete format nor for the public Rust, CLI and WASM APIs. See
compatibility.
Everything is built and tested in Docker — see
Getting started.