WebGPU coherence — finding contradictions between two unsure graphs
▸ Run the experiment → — a page you run yourself, on your own GPU: it explains the idea, lets you paste an argument to find its cracks, then benchmarks WebGPU against a single CPU core on your actual hardware.
This is an experiment, not a shipped feature: a real benchmark with honest numbers, including where the idea does not pay off.
The question
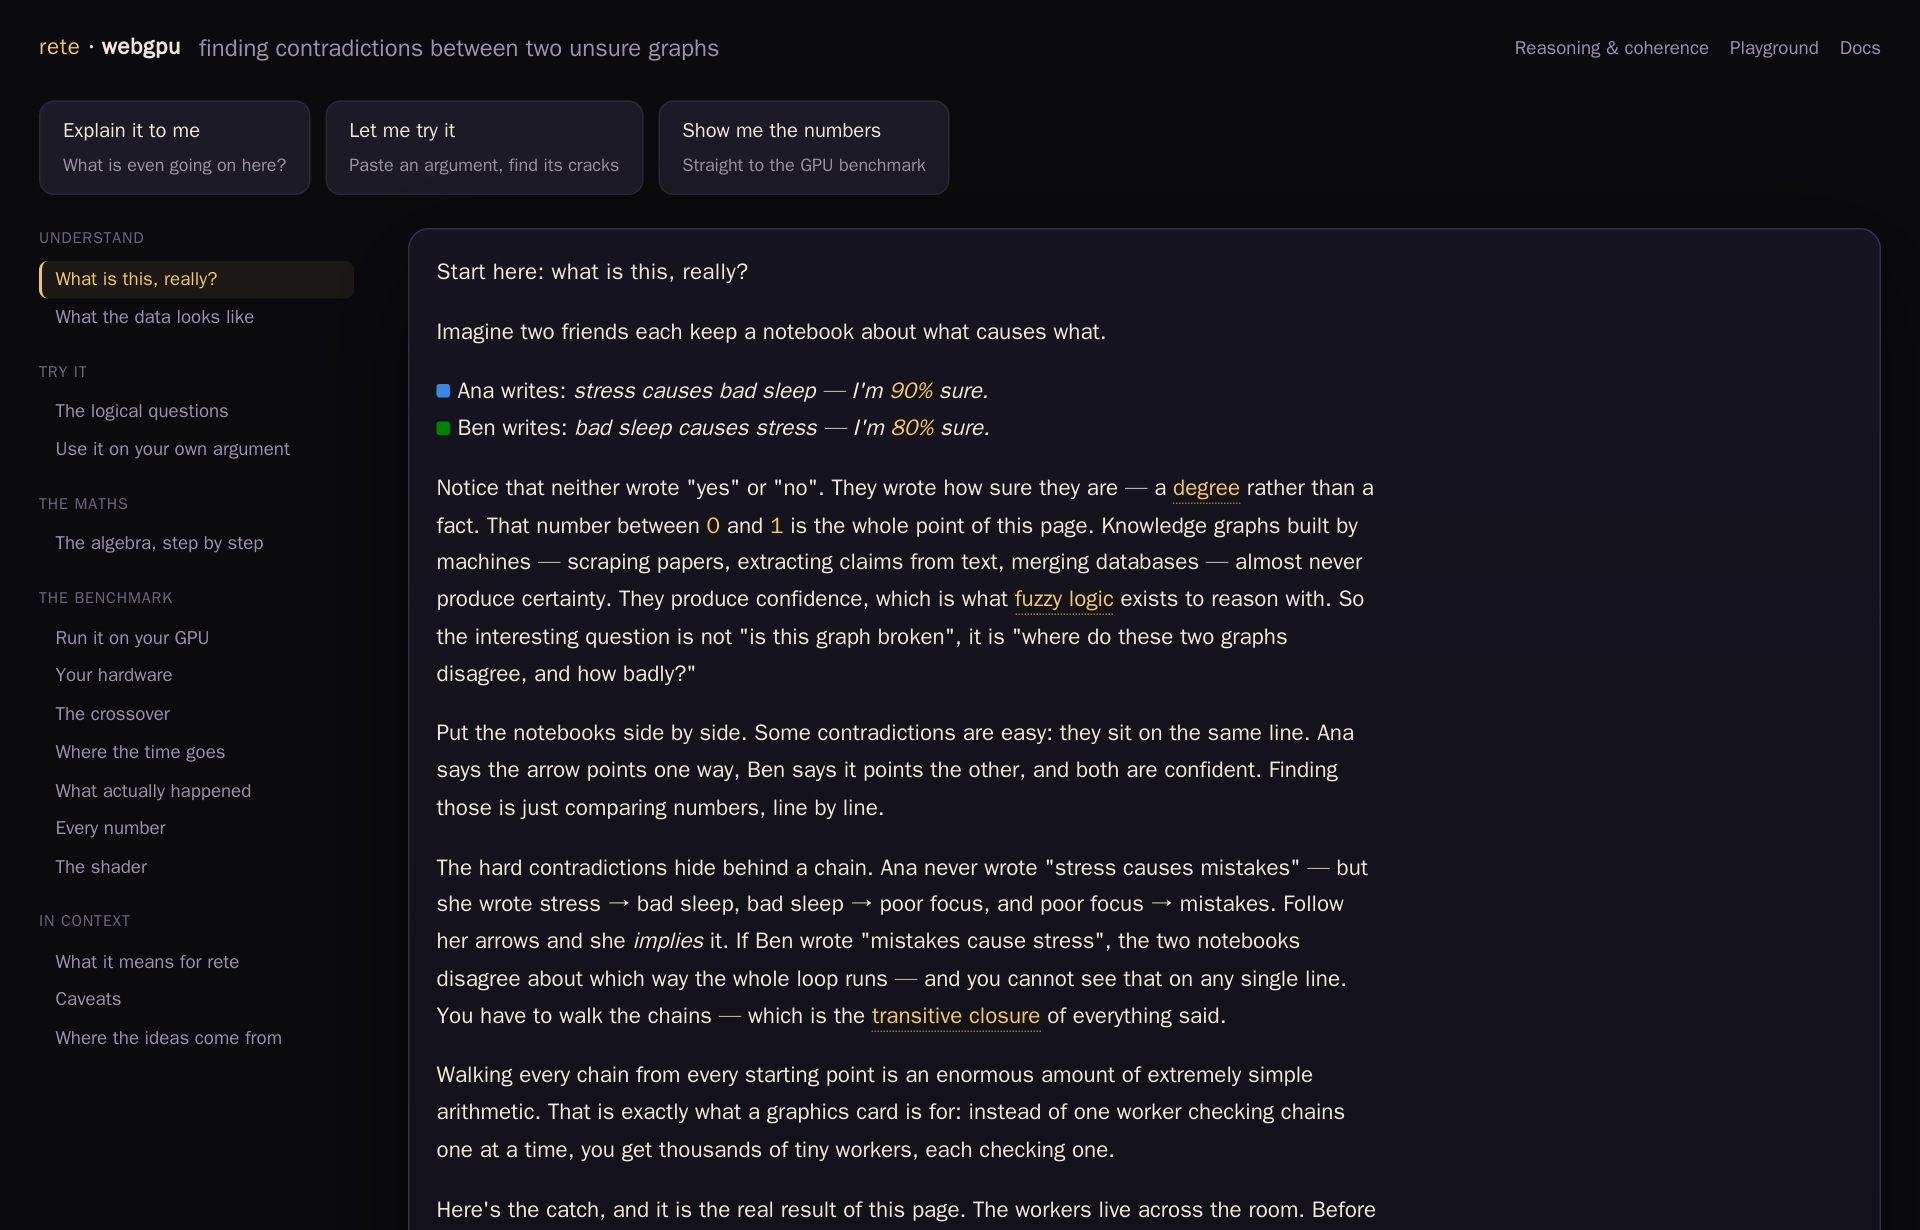
Knowledge graphs built by machines — scraped from papers, extracted from text, merged from databases — almost never produce certainty. They produce confidence: a degree between 0 and 1, reasoned about with fuzzy logic rather than plain boolean logic. So the interesting question is not "is this graph wrong", it's where do two such graphs disagree, and by how much.
Some contradictions are easy: two claims sit on the same line, one graph's arrow pointing one way and the other's the opposite, and comparing them is a single number-to-number check. The hard ones hide behind a chain — no single claim contradicts anything, but following the arrows (the graph's transitive closure, computed with max-min composition instead of ordinary matrix multiply) reveals that a graph implies something its own author never wrote, and that implication is what clashes with the other graph.
What you can do on the page
Read the explanation of same-line vs. chained contradictions with a worked six-statement example, then paste your own cause-and-effect argument into an editable sandbox to see which of its claims disagree, echo each other, or form a suspicious cycle. From there, the page turns into a benchmark you run yourself: it generates a synthetic fuzzy graph of your chosen size, runs the same two checks as WebGPU compute shaders, races them against a single CPU core (an honest baseline, since rete's own engine is single-threaded in the browser too), and reports your GPU's numbers next to the reference run.
The honest result
WebGPU is not a general win here. For an elementwise same-line check
(min of two confidence values, counted), the speedup plateaus around
2×, because at scale almost all the wall-clock time is spent uploading
data, not computing. For the chained check — an iterated max-min closure,
the operation behind hidden contradictions — the win is real: 15–17×
end-to-end, and 144–212× when only the compute is counted. Same GPU,
same data; the difference is how much arithmetic each kernel does per byte
moved.
The practical rule that falls out of this: stage once, run many. Upload
bandwidth is the wall, so a coherence check only pays for its own upload if
you sweep several thresholds or rules against the same resident graph rather
than uploading once per question. And this is explicitly not an argument
for GPU-accelerated SPARQL — remote .rete queries are bound by network
round trips and local ones already finish in single-digit milliseconds, both
well below the latency floor of a GPU dispatch. The win only shows up for
whole-graph, seconds-scale batch jobs like this one.
See also reasoning & coherence for the OWL 2 QL side of consistency checking, and SPARQL support for RDF-star, which is how a confidence value attaches to a triple in the first place.