Redrawing Lombardi — network drawings as a live graph
▸ Open the drawings → — Mark Lombardi hand-inked networks
of banks, shell companies, arms deals and political scandal as diagrams of
names joined by curved lines. This page reads 51 of those drawings live out of
one lombardi.rete file over HTTP range and redraws each one in the browser —
nothing pre-rendered, every line comes back out of the graph.
Finding a drawing
Search the sidebar's 51 titles (Harken, BCCI, Nugan Hand…), each listed
with its node, arc and year-span counts, and pick one to have it redraw on the
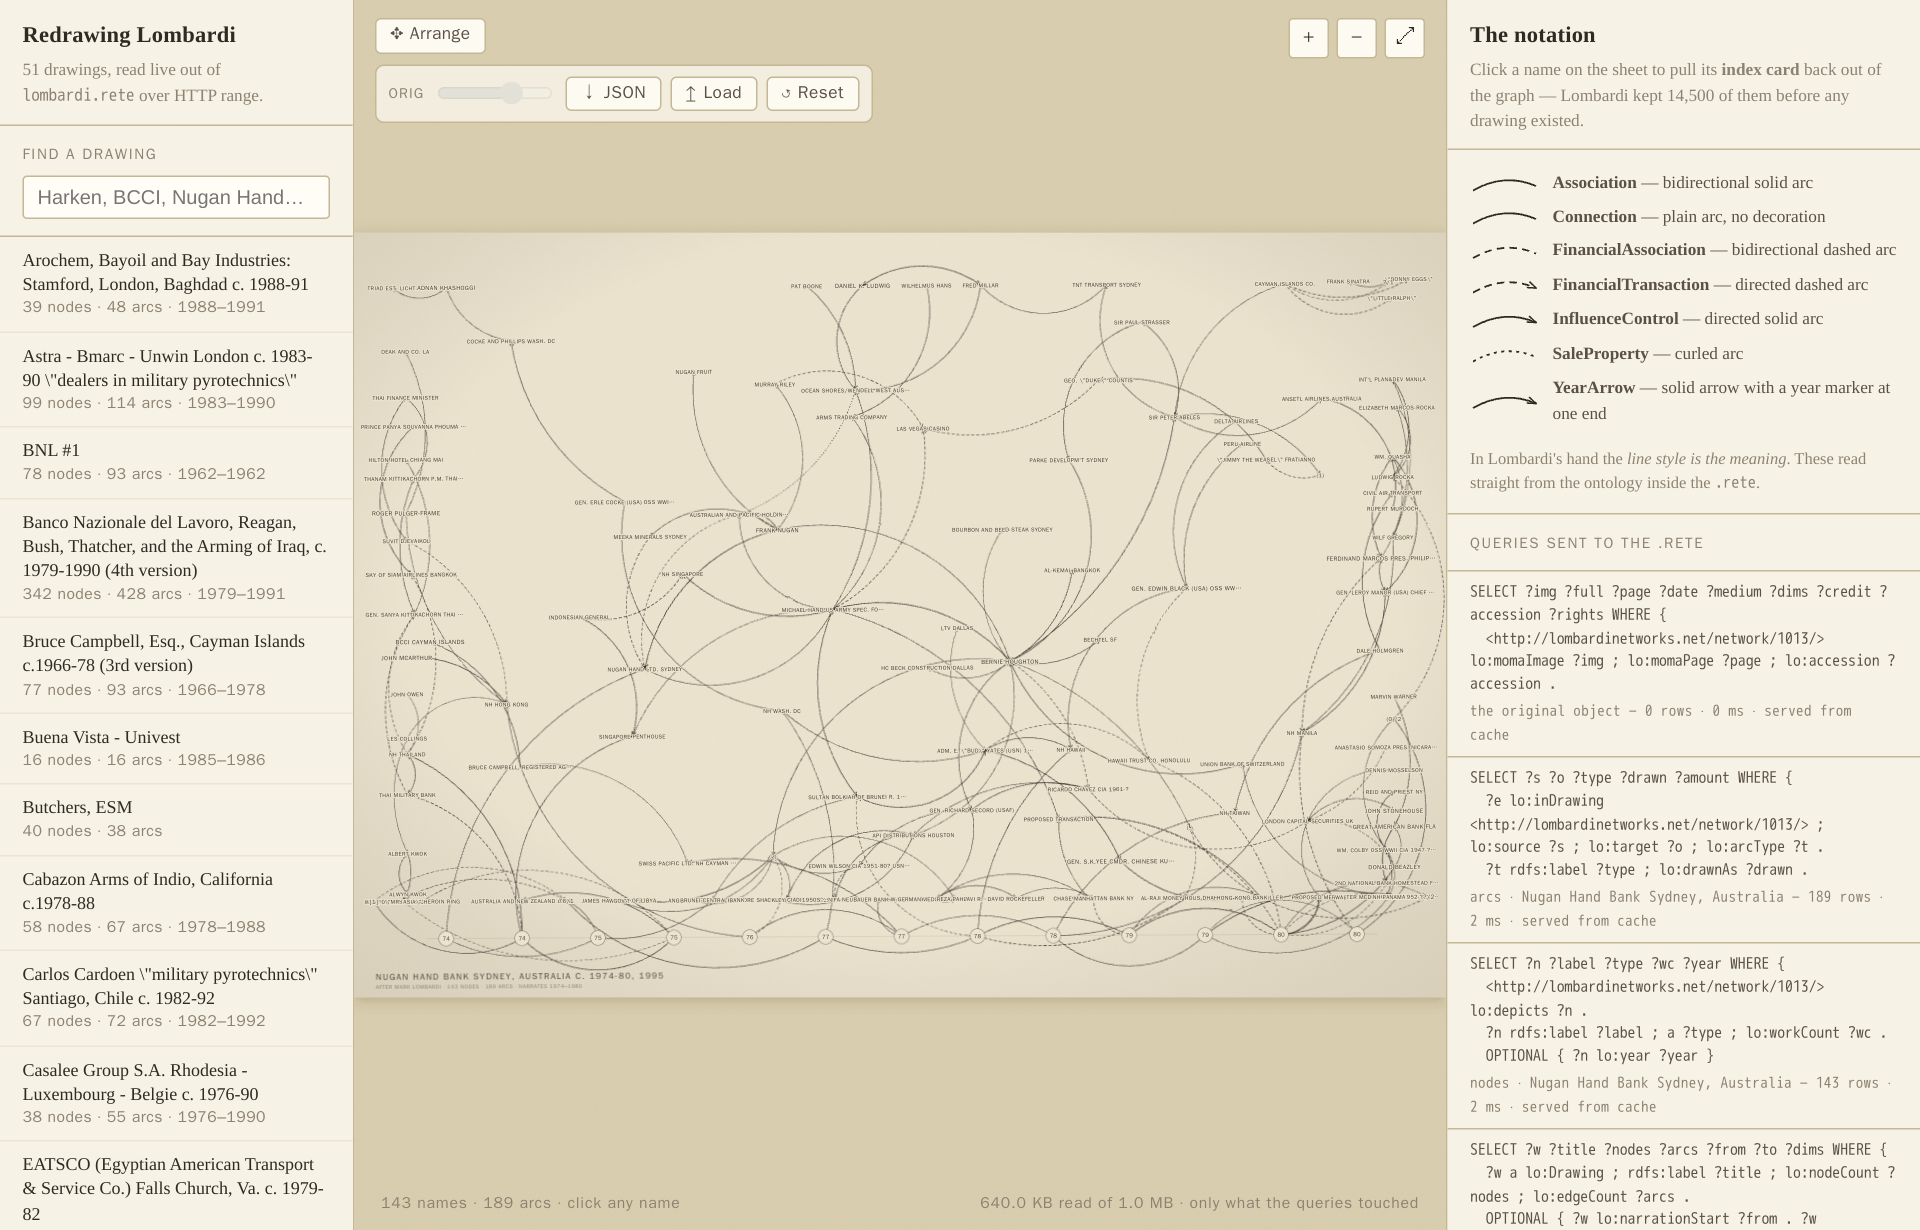
sheet. In Lombardi's hand the line style itself is the meaning, so the
notation legend beside the drawing is drawn straight from the ontology inside
the .rete and lists only the arc types actually present in that sheet:
Association as a bidirectional solid arc, FinancialTransaction as a
directed dashed arc, InfluenceControl as a directed solid arc, SaleProperty
as a finely dotted curl with no arrowhead, YearArrow as a solid arrow into a
small ringed year marker along the timeline at the foot of the sheet. Click any
name to pull its index card — who it reaches, who reaches it, and which
other sheets it appears on — the browser's equivalent of the 14,500 real cards
Lombardi kept before he drew a single line.
Tracing what he never recorded
For the 17 drawings MoMA holds, an Arrange control lays the photographed original behind the redrawn names, with a slider that fades it in and out, so you can drag each name onto where Lombardi actually placed it — a layer no source ever captured, since Tolksdorf digitized who-connects-to-whom, never coordinates. The traced positions download as JSON, Load reopens a saved trace, and Reset throws it away for the automatic layout again.
One graph, not 51
The 51 titles look like separate posters, but they aren't: Tolksdorf gave the same actor the same node id wherever Lombardi drew it again, so hundreds of people, banks and shells recur across sheets and the whole set joins into one connected graph — following BCCI or a name like George H.W. Bush across drawings is a graph walk, not a coincidence of spelling. Every panel on the page is a live SPARQL query, and the "queries sent to the .rete" log makes the cost of that visible: opening a drawing might read "640 KB read of 1.0 MB — only what the queries touched," because a range read pulls only the bytes each query needs, never the whole file.
The same data, queryable
lombardi— all 51 drawings as one graph, 70.4K triples: query who connects two scandals, which actors recur across sheets, or turn reasoning on to derive every typed arc.
Digitized node by node and arc by arc by Robert Tolksdorf (Freie Universität Berlin) from Mark Lombardi's originals, published at lombardinetworks.net under CC BY-NC-SA 4.0 — this graph carries that licence and credit forward.